svi <- find_svi(year = 2016, geography = "zcta", full.table = TRUE)5 Social Vulnerability Index
5.1 Data Procurement
- Raw 2016-2012 ACS data used for calculations were downloaded from the
findSVIpackage using thetidycensusdependency.
- ZCTA to County Crosswalk was downloaded from https://www2.census.gov/geo/docs/maps-data/data/rel/zcta_county_rel_10.txt
5.2 Data Processing
The findSVI package calculates SVI percentiles for a geography of choice. In this case, we used ZCTAs.
- The
find_svicommand was used to both download 2012-2016 ACS data at the ZCTA level and calculate the SVI quartiles as according to the CDC/ASTDR SVI documentation. - Utilizing the ZCTA to county crosswalk, which contains a list of every ZCTA and its intersecting states, the
find_sviresults were limited to those ZCTAs which intersect with Texas and Louisiana - Results were output to a parquet
More information about the findSVI package can be found here.
5.3 Data Output
TXLA_ZCTA_SVI1216.parquet
5.4 Code
The variables used in this calculation are as follows:
library(findSVI)
library(tidycensus)
library(tidyverse)

acs2016vars <- c("acs5", "acs5/subject", "acs5/profile", "acs5/cprofile") %>%
  map_df(~ load_variables(2016, .x) %>% mutate(table = .x)) %>%
  select(-concept, -geography)

census_variables_2016 %>%
  map(~ filter(acs2016vars, name %in% str_sub(.x, end = -2))) %>%
  map(knitr::kable)
$t0
| name | label | table |
|---|---|---|
| S0601_C01_001 | Total!!Estimate!!Total population | acs5/subject |
| DP02_0001 | Estimate!!HOUSEHOLDS BY TYPE!!Total households | acs5/profile |
| DP04_0001 | Estimate!!HOUSING OCCUPANCY!!Total housing units | acs5/profile |
$t1
| name | label | table |
|---|---|---|
| B06009_002 | Estimate!!Total!!Less than high school graduate | acs5 |
| B17001_002 | Estimate!!Total!!Income in the past 12 months below poverty level | acs5 |
| B19301_001 | Estimate!!Per capita income in the past 12 months (in 2016 inflation-adjusted dollars) | acs5 |
| S0601_C01_033 | Total!!Estimate!!EDUCATIONAL ATTAINMENT!!Population 25 years and over!!Less than high school graduate | acs5/subject |
| S0601_C01_049 | Total!!Estimate!!POVERTY STATUS IN THE PAST 12 MONTHS!!Population for whom poverty status is determined!!Below 100 percent of the poverty level | acs5/subject |
| DP03_0005 | Estimate!!EMPLOYMENT STATUS!!Population 16 years and over!!In labor force!!Civilian labor force!!Unemployed | acs5/profile |
| DP03_0009P | Percent!!EMPLOYMENT STATUS!!Civilian labor force!!Unemployment Rate | acs5/profile |
$t2
| name | label | table |
|---|---|---|
| B09001_001 | Estimate!!Total | acs5 |
| S0101_C01_028 | Total!!Estimate!!SELECTED AGE CATEGORIES!!65 years and over | acs5/subject |
| DP02_0007 | Estimate!!HOUSEHOLDS BY TYPE!!Total households!!Family households (families)!!Male householder, no wife present, family!!With own children of the householder under 18 years | acs5/profile |
| DP02_0009 | Estimate!!HOUSEHOLDS BY TYPE!!Total households!!Family households (families)!!Female householder, no husband present, family!!With own children of the householder under 18 years | acs5/profile |
| DP02_0071 | Estimate!!DISABILITY STATUS OF THE CIVILIAN NONINSTITUTIONALIZED POPULATION!!Total Civilian Noninstitutionalized Population!!With a disability | acs5/profile |
| DP02_0071P | Percent!!DISABILITY STATUS OF THE CIVILIAN NONINSTITUTIONALIZED POPULATION!!Total Civilian Noninstitutionalized Population!!With a disability | acs5/profile |
$t3
| name | label | table |
|---|---|---|
| B01001H_001 | Estimate!!Total | acs5 |
| B16005_001 | Estimate!!Total | acs5 |
| B16005_007 | Estimate!!Total!!Native!!Speak Spanish!!Speak English “not well” | acs5 |
| B16005_008 | Estimate!!Total!!Native!!Speak Spanish!!Speak English “not at all” | acs5 |
| B16005_012 | Estimate!!Total!!Native!!Speak other Indo-European languages!!Speak English “not well” | acs5 |
| B16005_013 | Estimate!!Total!!Native!!Speak other Indo-European languages!!Speak English “not at all” | acs5 |
| B16005_017 | Estimate!!Total!!Native!!Speak Asian and Pacific Island languages!!Speak English “not well” | acs5 |
| B16005_018 | Estimate!!Total!!Native!!Speak Asian and Pacific Island languages!!Speak English “not at all” | acs5 |
| B16005_022 | Estimate!!Total!!Native!!Speak other languages!!Speak English “not well” | acs5 |
| B16005_023 | Estimate!!Total!!Native!!Speak other languages!!Speak English “not at all” | acs5 |
| B16005_029 | Estimate!!Total!!Foreign born!!Speak Spanish!!Speak English “not well” | acs5 |
| B16005_030 | Estimate!!Total!!Foreign born!!Speak Spanish!!Speak English “not at all” | acs5 |
| B16005_034 | Estimate!!Total!!Foreign born!!Speak other Indo-European languages!!Speak English “not well” | acs5 |
| B16005_035 | Estimate!!Total!!Foreign born!!Speak other Indo-European languages!!Speak English “not at all” | acs5 |
| B16005_039 | Estimate!!Total!!Foreign born!!Speak Asian and Pacific Island languages!!Speak English “not well” | acs5 |
| B16005_040 | Estimate!!Total!!Foreign born!!Speak Asian and Pacific Island languages!!Speak English “not at all” | acs5 |
| B16005_044 | Estimate!!Total!!Foreign born!!Speak other languages!!Speak English “not well” | acs5 |
| B16005_045 | Estimate!!Total!!Foreign born!!Speak other languages!!Speak English “not at all” | acs5 |
$t4
| name | label | table |
|---|---|---|
| B26001_001 | Estimate!!Total | acs5 |
| DP04_0002 | Estimate!!HOUSING OCCUPANCY!!Total housing units!!Occupied housing units | acs5/profile |
| DP04_0012 | Estimate!!UNITS IN STRUCTURE!!Total housing units!!10 to 19 units | acs5/profile |
| DP04_0013 | Estimate!!UNITS IN STRUCTURE!!Total housing units!!20 or more units | acs5/profile |
| DP04_0014 | Estimate!!UNITS IN STRUCTURE!!Total housing units!!Mobile home | acs5/profile |
| DP04_0014P | Percent!!UNITS IN STRUCTURE!!Total housing units!!Mobile home | acs5/profile |
| DP04_0058 | Estimate!!VEHICLES AVAILABLE!!Occupied housing units!!No vehicles available | acs5/profile |
| DP04_0058P | Percent!!VEHICLES AVAILABLE!!Occupied housing units!!No vehicles available | acs5/profile |
| DP04_0078 | Estimate!!OCCUPANTS PER ROOM!!Occupied housing units!!1.01 to 1.50 | acs5/profile |
| DP04_0079 | Estimate!!OCCUPANTS PER ROOM!!Occupied housing units!!1.51 or more | acs5/profile |
$t5
| name | label | table |
|---|---|---|
| S2701_C04_001 | Uninsured!!Estimate!!Civilian noninstitutionalized population | acs5/subject |
| S2701_C05_001 | Percent Uninsured!!Estimate!!Civilian noninstitutionalized population | acs5/subject |
This single command downloads the 2015-2019 ACS5 at the zcta level and calculates the SVI theme percentiles for the entire country
Calculated SVI is filtered to the state of Texas (FIPS: 48) and Louisiana (FIPS: 22)
library(sf)
library(tigris)

ZCTAs <- read_csv("https://www2.census.gov/geo/docs/maps-data/data/rel/zcta_county_rel_10.txt") %>%
  filter(STATE %in% c(48, 22)) %>%
  distinct(ZCTA5) %>%
  rename(GEOID = ZCTA5)

ZCTAs_sf <- ZCTAs %>%
  left_join(zctas(cb = FALSE, year = 2017), by = join_by(GEOID == GEOID10)) %>%
  st_as_sf() %>%
  select(-c(ZCTA5CE10, CLASSFP10, MTFCC10, FUNCSTAT10, ALAND10, AWATER10, INTPTLAT10, INTPTLON10))

TXLA_svi <- svi %>%
  filter(GEOID %in% unlist(ZCTAs)) %>%
  select(-c(year, state)) %>%
mutate(across(starts_with("E_"), as.integer))library(gridExtra)
output_maps <- colnames(TXLA_svi) %>%
`[`(str_detect(., "theme")) %>%
map(~
TXLA_svi %>%
left_join(ZCTAs_sf) %>%
st_as_sf() %>%
ggplot() +
geom_sf(aes(fill = !!sym(.x)), linewidth = 0, color = NA) +
coord_sf(datum = "ESRI:102003") +
scale_fill_distiller(
palette = "BuPu",
guide = guide_colorbar(
direction = "horizontal",
title.position = "top")) +
theme_void() +
theme(
plot.title = element_text(face = "bold", size = 16),
plot.subtitle = element_text(face = "bold", size = 12),
plot.caption = element_text(size = 10, hjust = 0),
legend.title = element_text(face = "bold", size = 12),
legend.text = element_text(face = "bold", size = 12),
legend.title.align=0.5,
legend.position = "bottom",
legend.key.width = unit(dev.size()[1] / 20, "inches")) +
labs(
caption = "Author: Ryan Zomorrodi\nDate: 4/1/2024\nSource: FEMA National Flood Hazard Layer")
)
do.call(grid.arrange, c(output_maps, ncol = 2))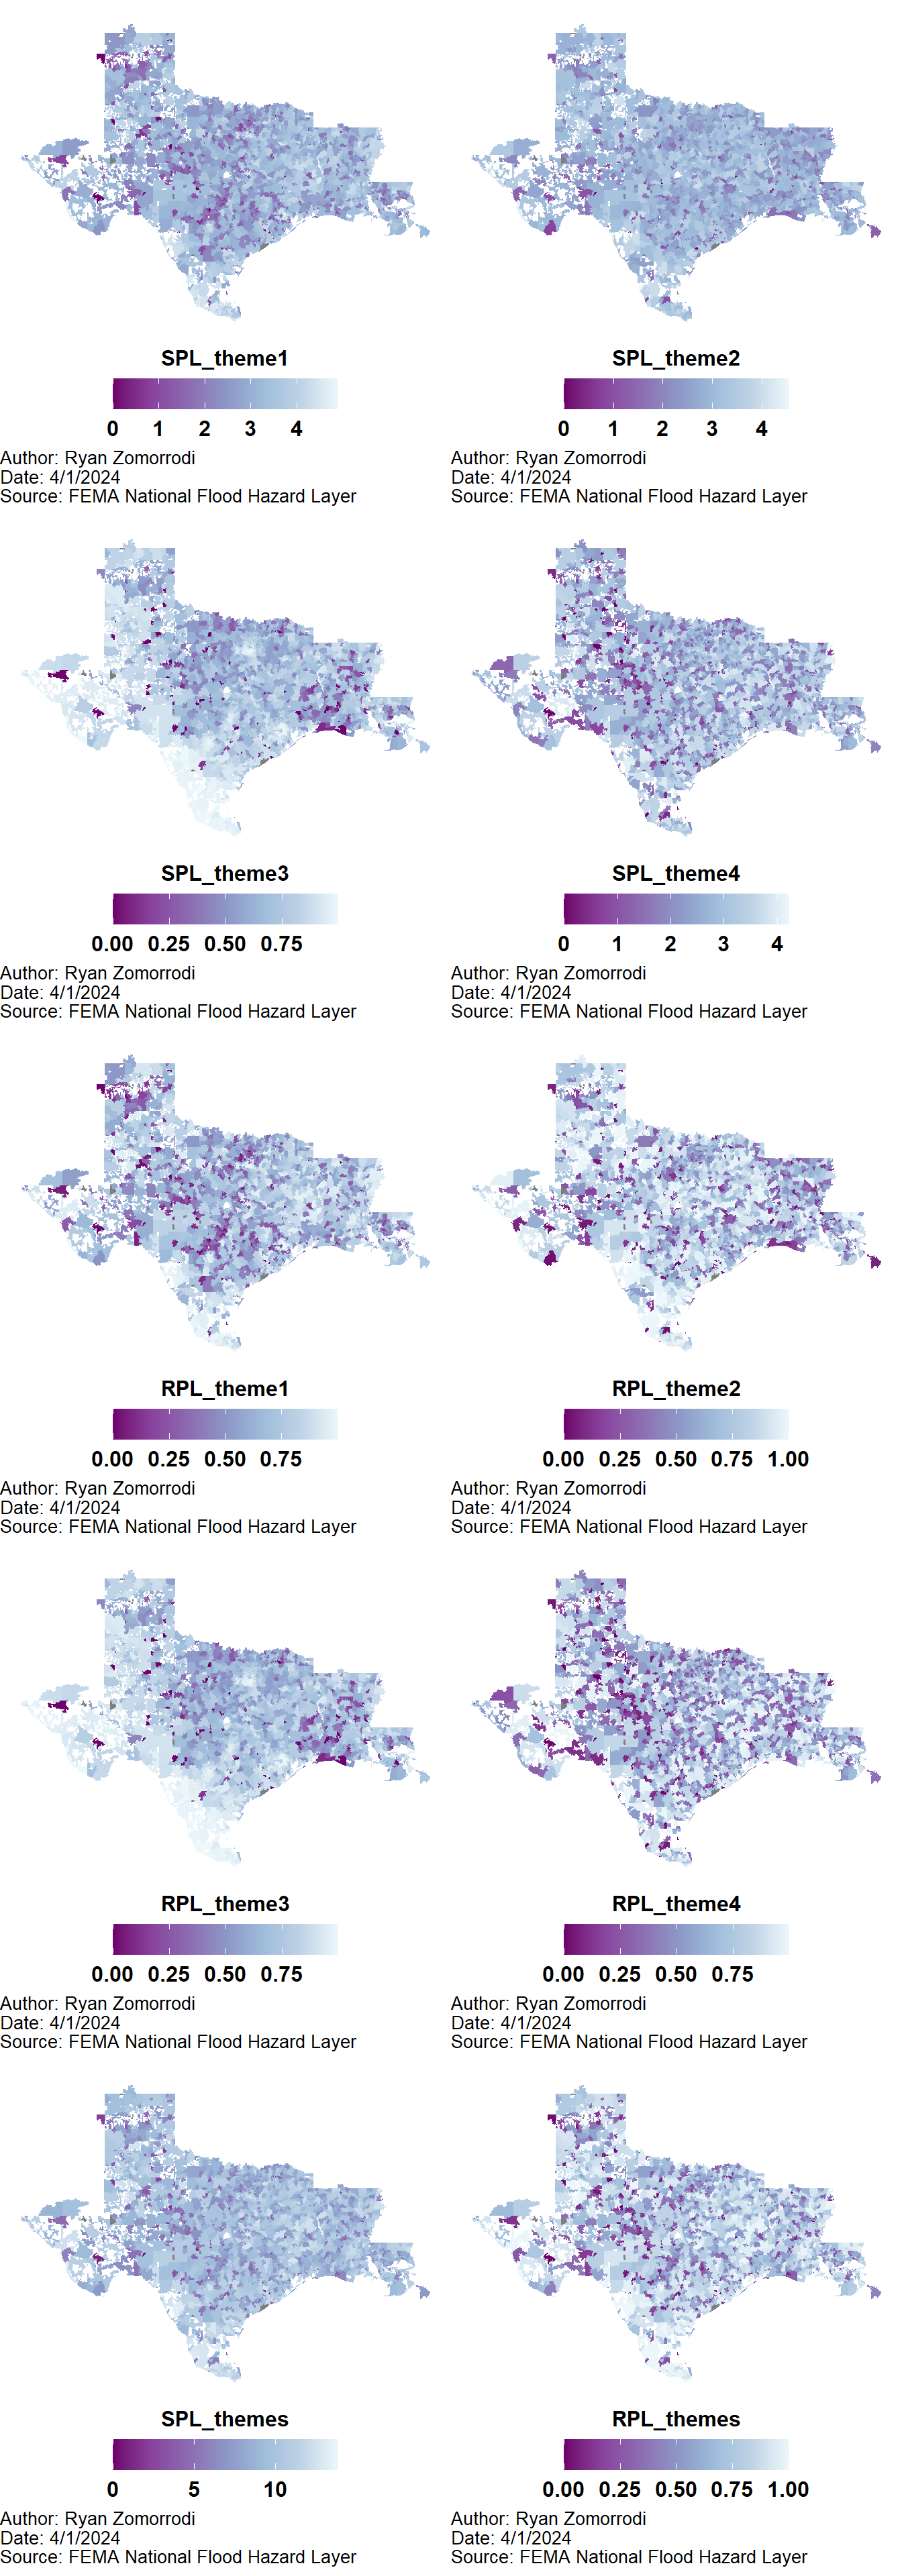
Outputed SVI to parquet.
library(arrow)

TXLA_svi %>%
  write_parquet("output/TXLA_ZCTA_SVI1216.parquet")