library(tidyverse)
library(sf)
library(hurricaneexposure)

data(hurr_tracks, package = "hurricaneexposuredata")

AL092017_track <- hurr_tracks %>%
  filter(usa_atcf_id == "AL092017") %>%
  create_full_track() %>%
  arrange(date) %>%
  st_as_sf(coords = c("tclon", "tclat"), crs = "epsg:4269")

AL092017_track_line <- AL092017_track %>%
  st_combine() %>%
st_cast("LINESTRING")4 Distance from Storm Track
4.1 Data Procurement
- Hurricane track data was downloaded from the
hurricaneexposuredatapackage using thedata("hurr_tracks")command. This data originates from the HURDAT2. - ZCTA to County Crosswalk was downloaded from https://www2.census.gov/geo/docs/maps-data/data/rel/zcta_county_rel_10.txt
- ZCTA shapefiles were downloaded for the entire US using the
tigrispackage
4.2 Data Processing
- Hurricane data was downloaded using
hurricaneexposuredatapackage using thedata("hurr_tracks")command and filtered using the Harvey Automated Tropical Cyclone Forecasting code (AL092017) - Hurricane track was imputed to every 15 minutes using
create_full_trackfrom thestormwindmodelpackage. - Separately, 2017 ZCTAs downloaded from the US Census Cartographic Boundary Files
- Then, the ZCTAs were joined to the US Census ZCTA to County Crosswalk in order to identify Texas and Louisiana ZCTAs
- The ZCTAs were filtered to Texas and Louisiana
- ZCTA geo centroid were calculated
- The distance from geo-centroid of each ZCTA to closest point on imputed track and time when imputed track was closest were calculated
4.3 Output
TXLA_ZCTA_dist2track- GEOID - ZCTA GEOID
- dist2track - Distance from geo-centroid to closest point on imputed track (meters)
- dateTime - UTC date and time where geo-centroid is closest to imputed track
Download, filter, and impute hurricane tract
Downloaded ZCTA shapefiles and calculated centroids
library(tigris)

ZCTAs <- read_csv("https://www2.census.gov/geo/docs/maps-data/data/rel/zcta_county_rel_10.txt") %>%
  filter(STATE %in% c(48, 22)) %>%
  distinct(ZCTA5) %>%
  rename(GEOID = ZCTA5)

ZCTAs_sf <- ZCTAs %>%
  left_join(zctas(cb = FALSE, year = 2017), by = join_by(GEOID == GEOID10)) %>%
  st_as_sf() %>%
  select(-c(ZCTA5CE10, CLASSFP10, MTFCC10, FUNCSTAT10, ALAND10, AWATER10, INTPTLAT10, INTPTLON10))

ZCTAs_center <- ZCTAs_sf %>%
  st_transform("ESRI:102003") %>%
  st_centroid() %>%
  st_transform("EPSG:4269")
Calculated shortest distance to track from geo centroids
TXLA_dist2track <- st_join(ZCTAs_center, AL092017_track, join = st_nearest_feature) %>%
  rename(dateTime = date) %>%
  rowwise() %>%
  mutate(est_track_point =
    AL092017_track %>%
      filter(date == dateTime) %>%
      st_geometry()
  ) %>%
  mutate(dist2track = st_distance(geometry, est_track_point)) %>%
  mutate(dist2track = as.numeric(dist2track)) %>%
  st_drop_geometry() %>%
  select(GEOID, dateTime, dist2track)
TXLA_dist2track %>%
left_join(ZCTAs_sf) %>%
st_as_sf() %>%
ggplot() +
geom_sf(aes(fill = dist2track)) +
geom_sf(data = st_crop(AL092017_track_line, ZCTAs_sf)) +
coord_sf(datum = "ESRI:102003") +
scale_fill_distiller(
palette = "Oranges",
name = "Smallest Distance to Hurricane Track",
direction = 1,
guide = guide_colorbar(
direction = "horizontal",
title.position = "top")) +
theme_void() +
theme(
plot.title = element_text(face = "bold", size = 16),
plot.subtitle = element_text(face = "bold", size = 12),
plot.caption = element_text(size = 10, hjust = 0),
legend.title = element_text(face = "bold", size = 12),
legend.text = element_text(face = "bold", size = 12),
legend.title.align=0.5,
legend.position = "bottom",
legend.key.width = unit(dev.size()[1] / 10, "inches")) +
labs(
title = "Smallest Distance to Hurricane Track by ZCTA ",
subtitle = "Texas and Louisiana",
caption = "Author: Ryan Zomorrodi\nDate: 4/1/2024\nSource: hurricaneexposuredata")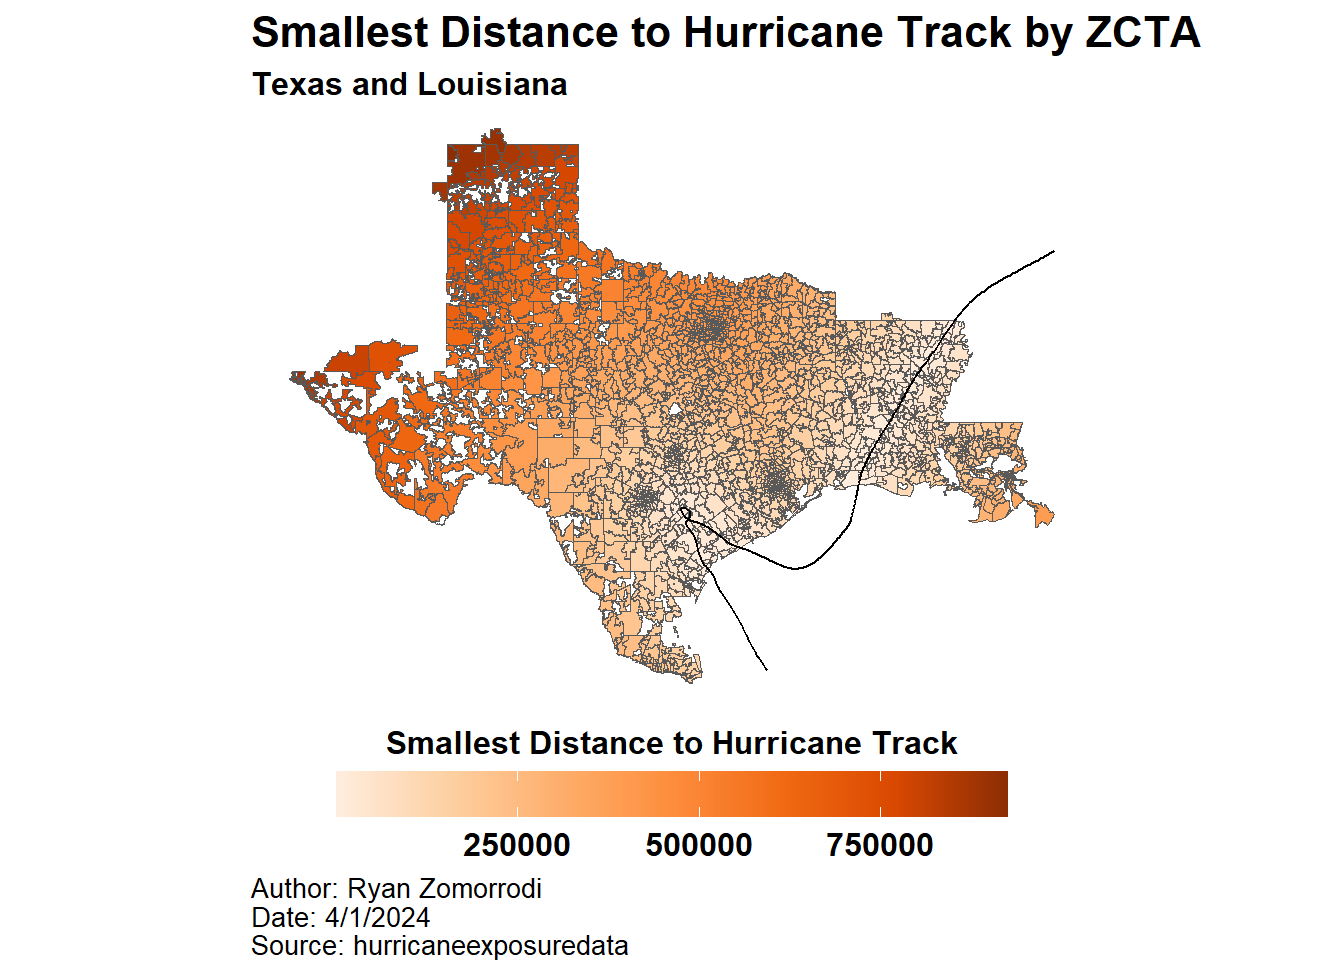
TXLA_dist2track %>%
  st_write("output/TXLA_ZCTA_dist2track.gpkg", "TXLA_ZCTA_dist2track", append = FALSE)